Project:
A/B Testing Design Process
A/B Testing Design Process
Pizza Hut
Associate Manager, UX Design
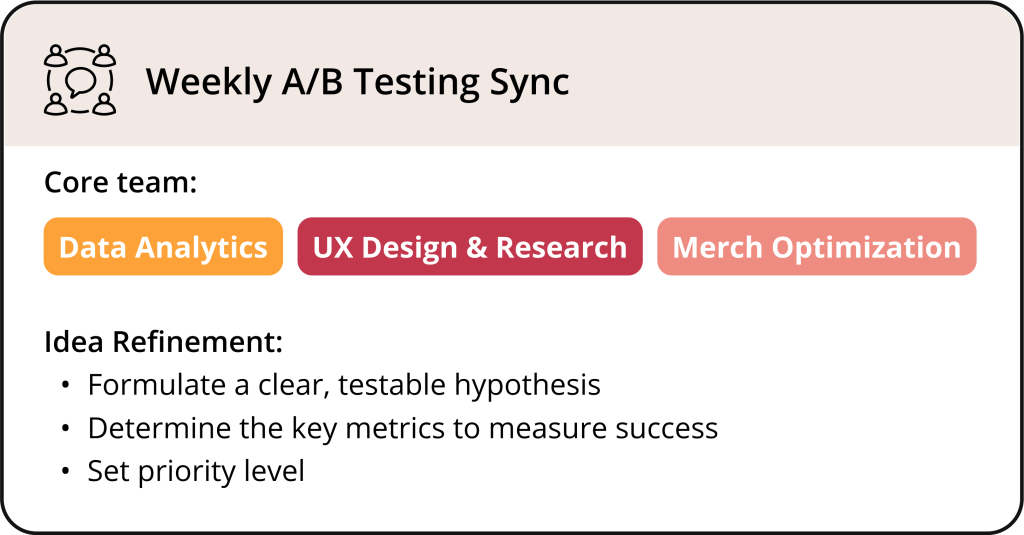
Pizza Hut Data Analytics Team
Optimizely
This micro-study highlights the creation of a formalized design process to support a robust and scalable A/B testing pipeline. The initiative aimed to streamline the delivery of impactful design concepts while ensuring consistent and reliable measurement of their outcomes.
I identified workflow challenges, established an A/B testing design process, and worked closely with cross-functional teams to align with program goals. From there, I created a Confluence space to track concepts, developed a reusable Figma template, onboarded UX team members to ensure smooth adoption, and piloted the new process across multiple active projects.

Figma

Confluence

Jira

Optimizely
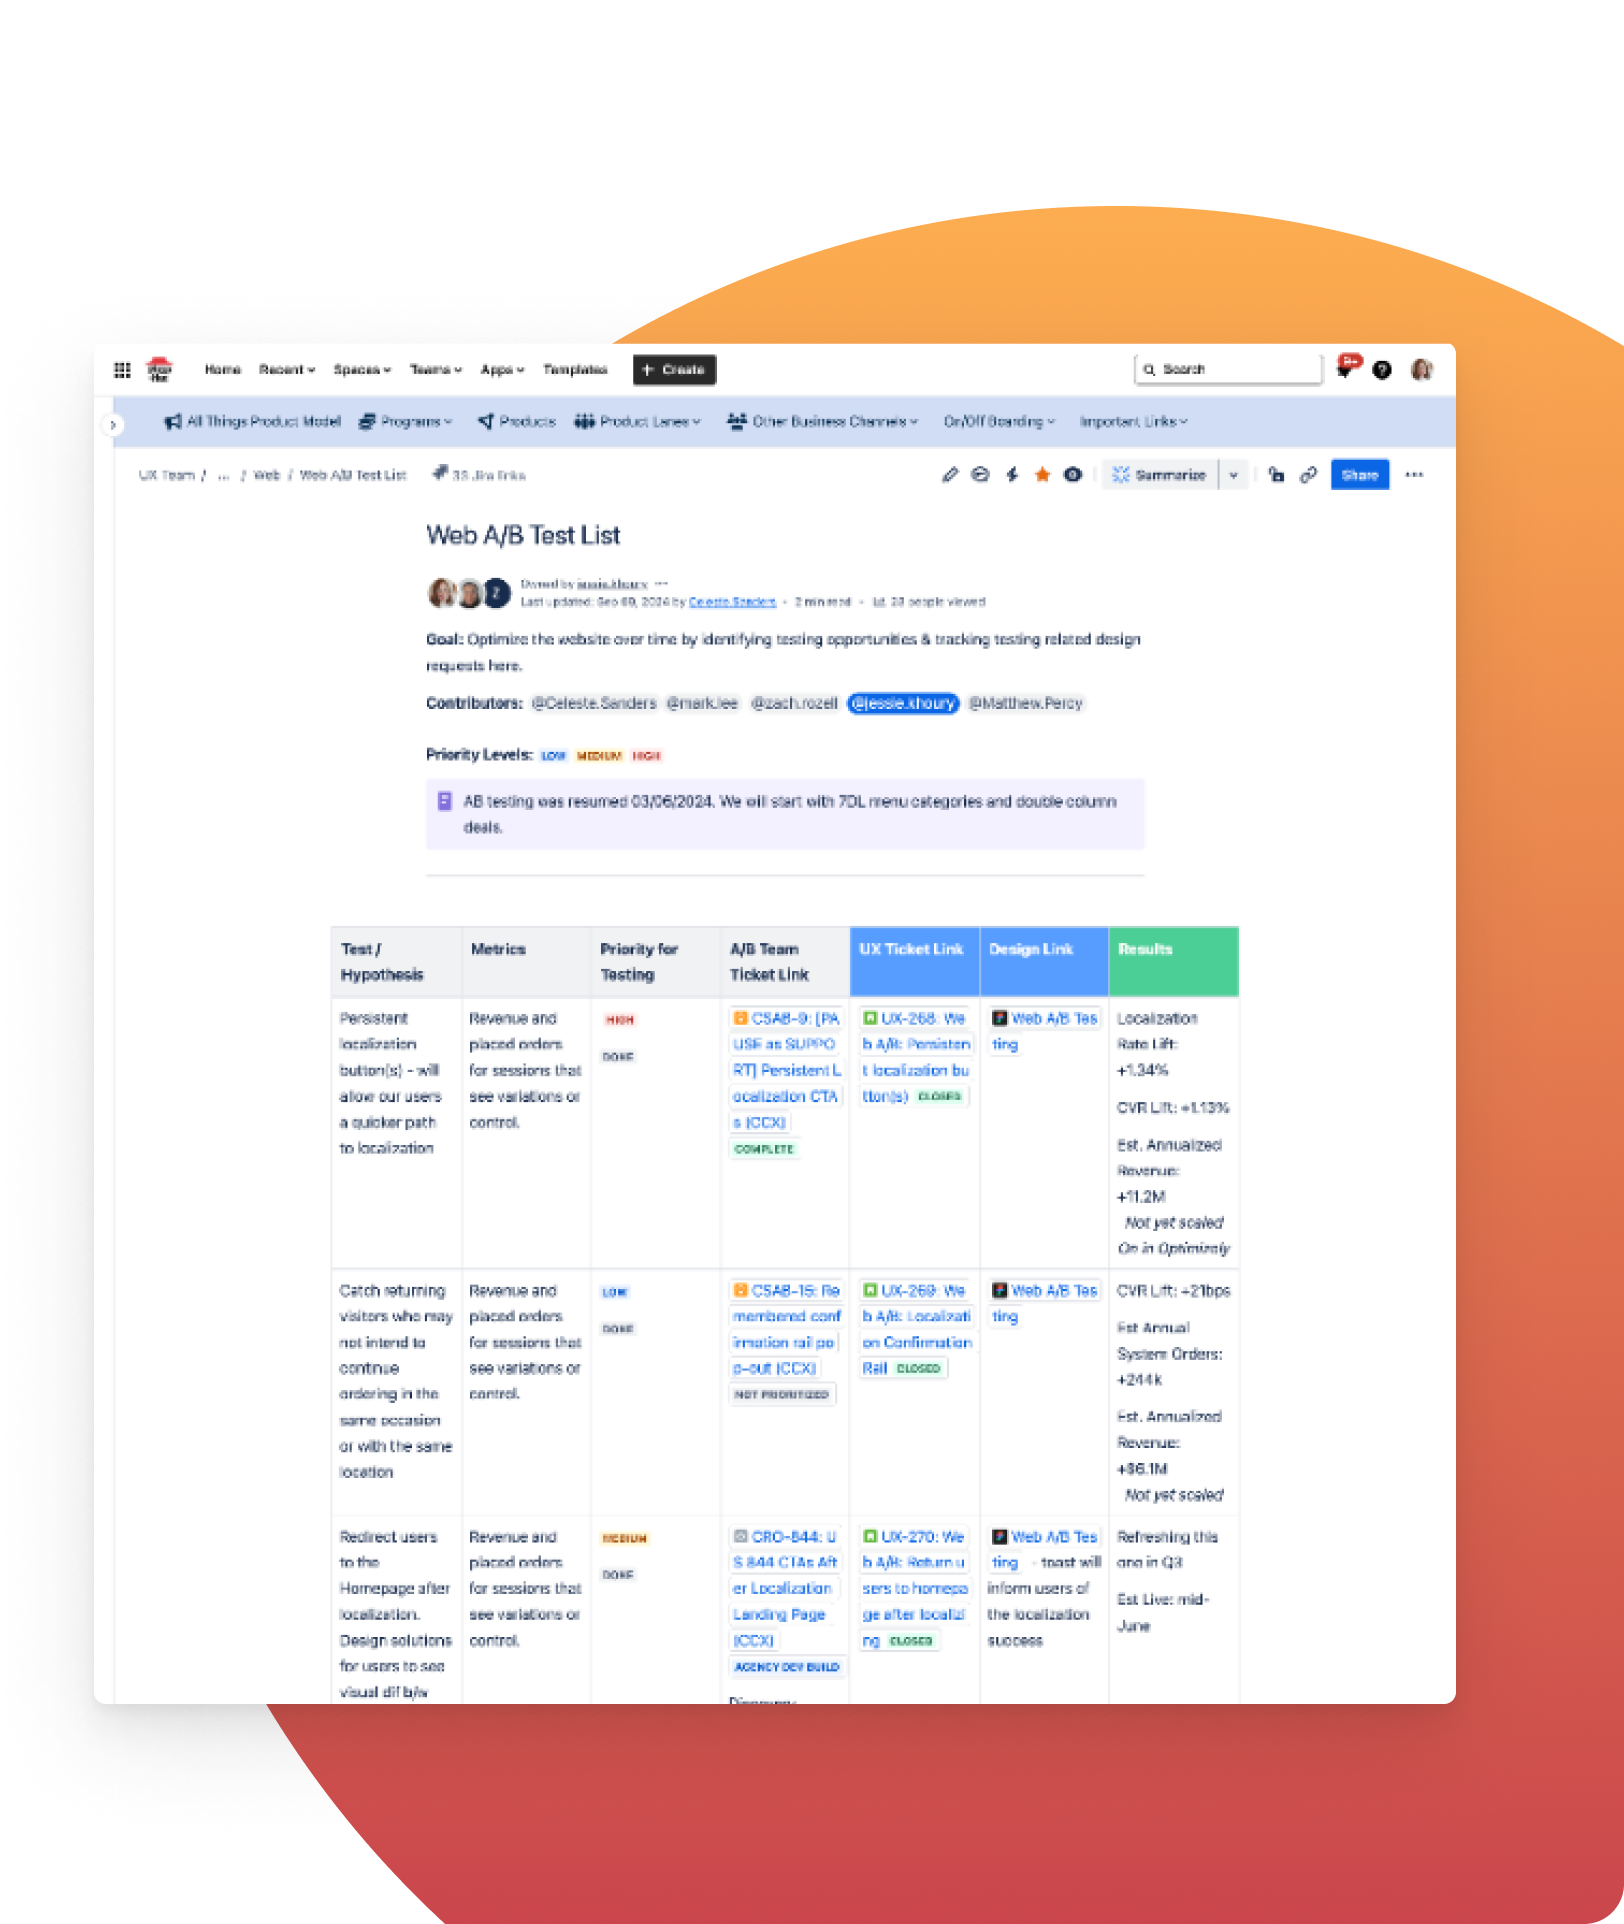

No centralized tracking of test concepts

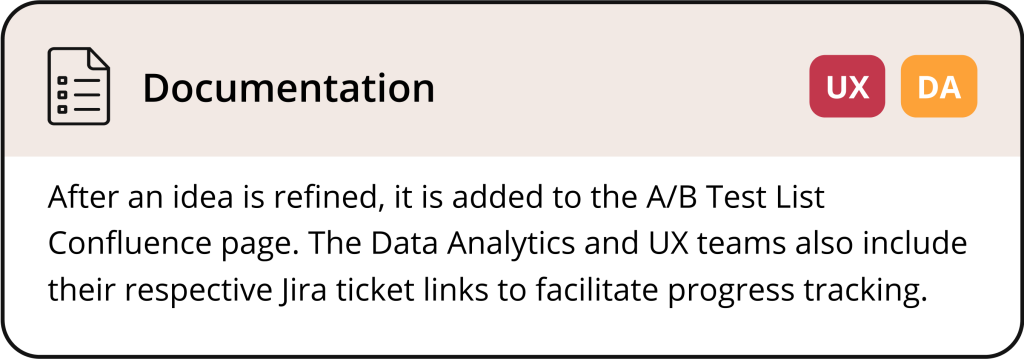
A Confluence page capturing testing concepts, tickets, and results for better organization and visibility
Lack of clear design prioritization and visibility
UX Jira tickets to give cross-functional teams clear visibility into design priorities for new concepts and progress on existing ones.
A single, disorganized Figma file containing all test designs
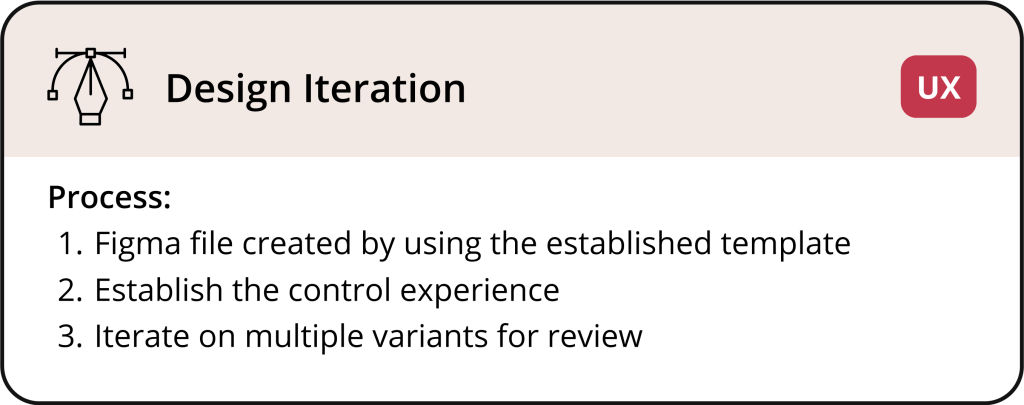
Dedicated Figma files for each concept, allowing for more iteration and scalability, and resulting in clearer, production-ready designs.
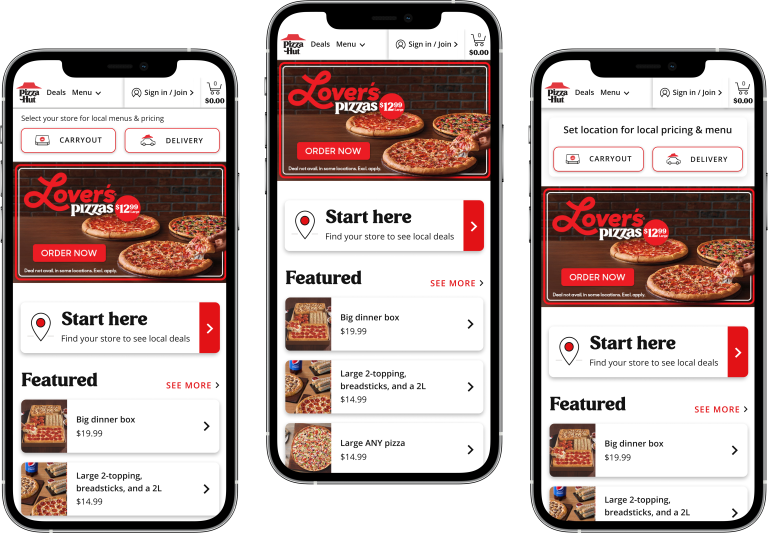
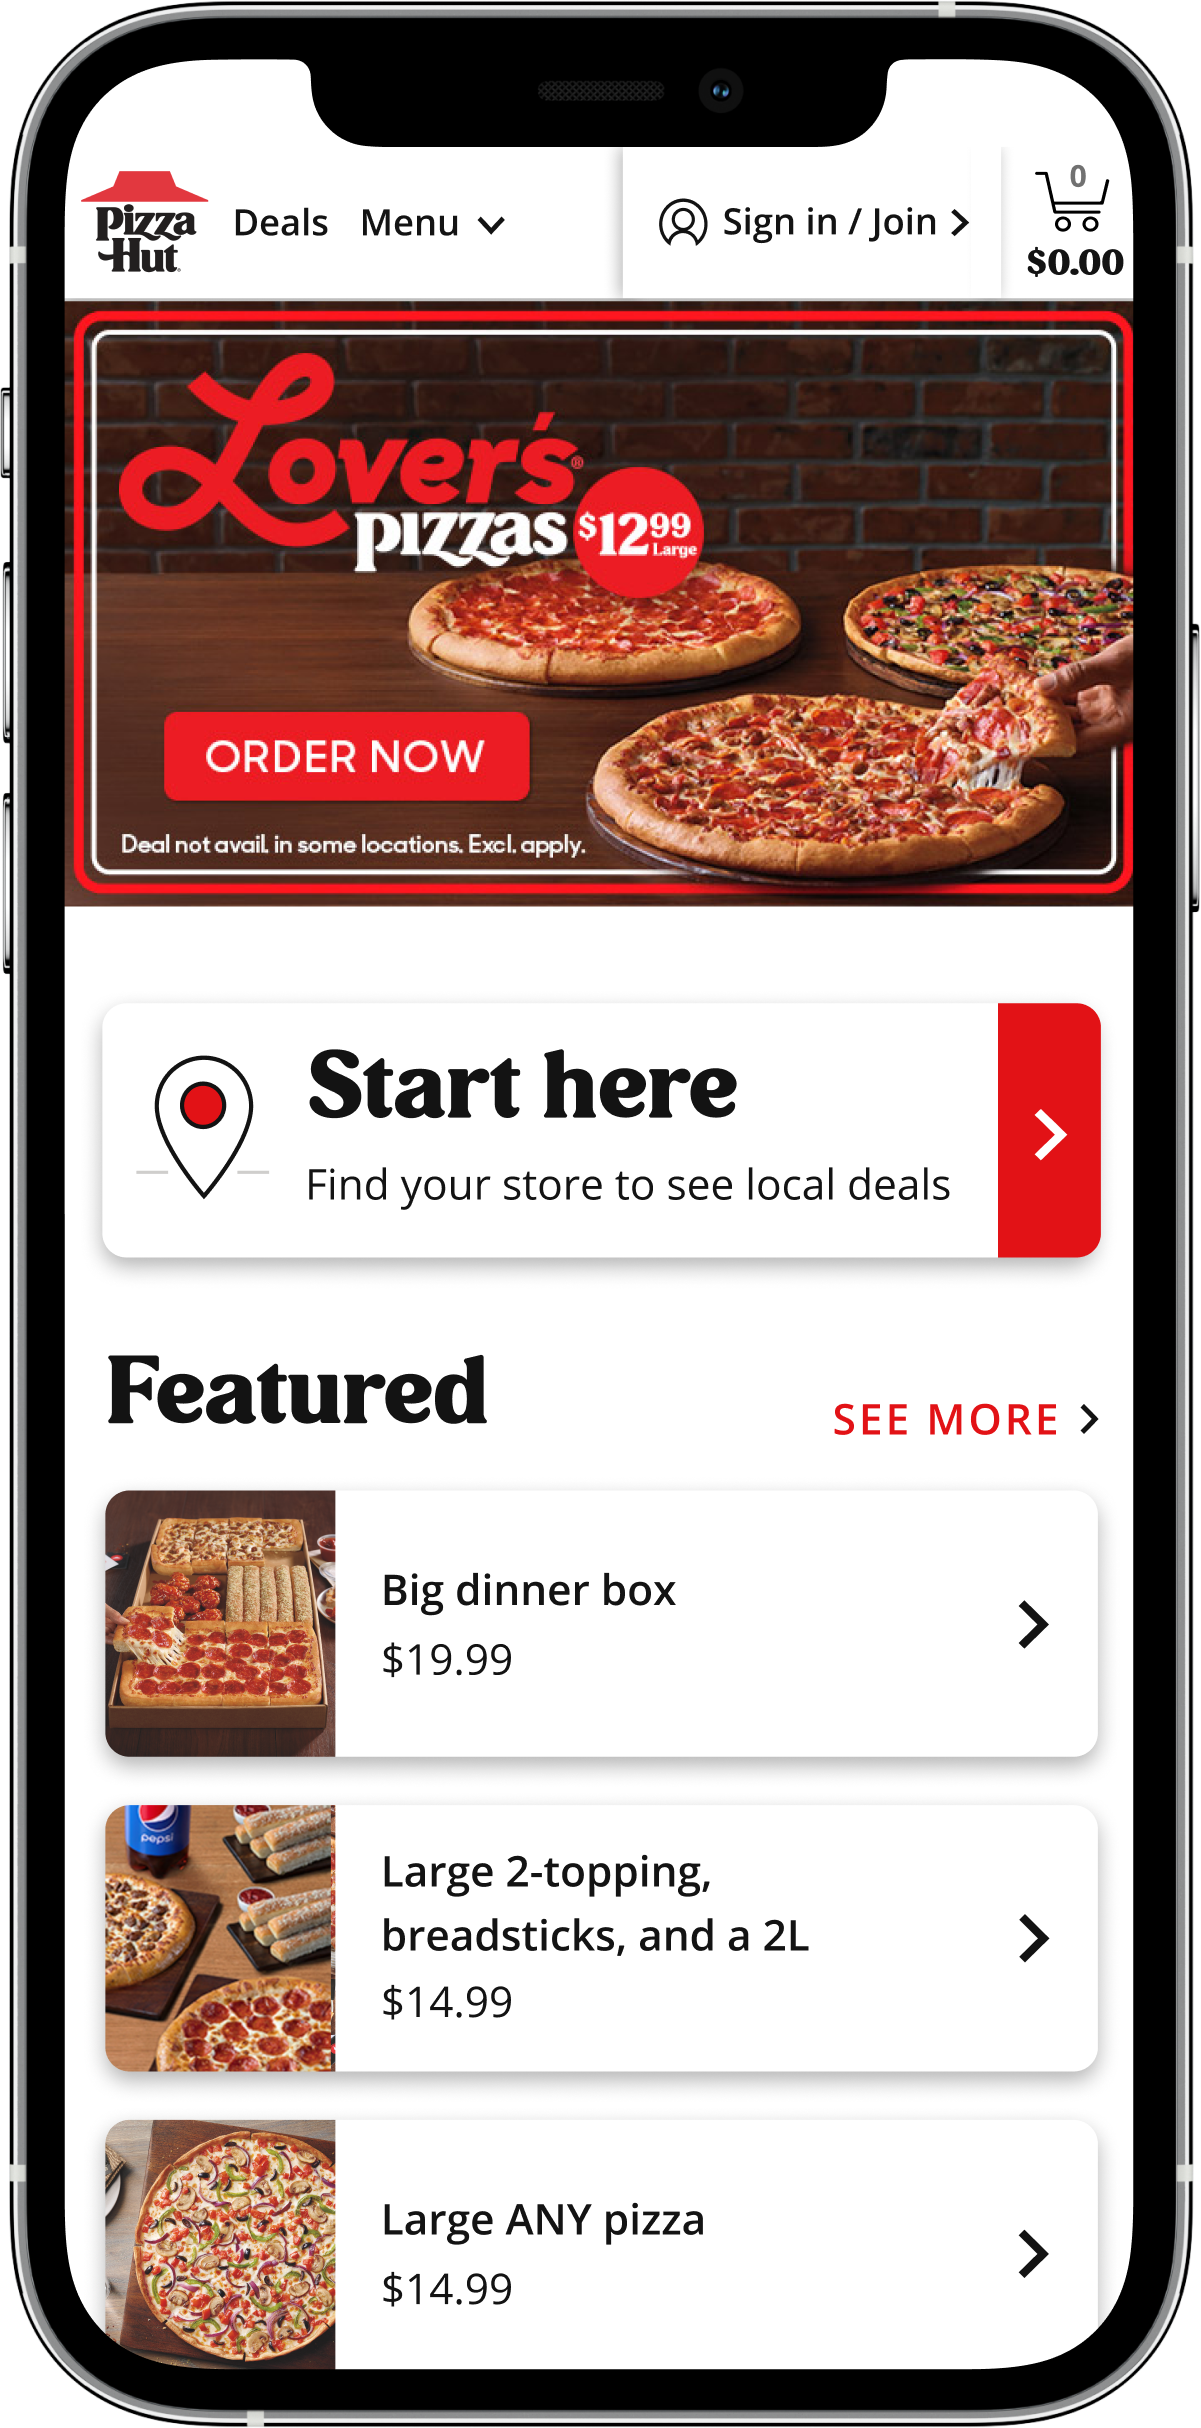
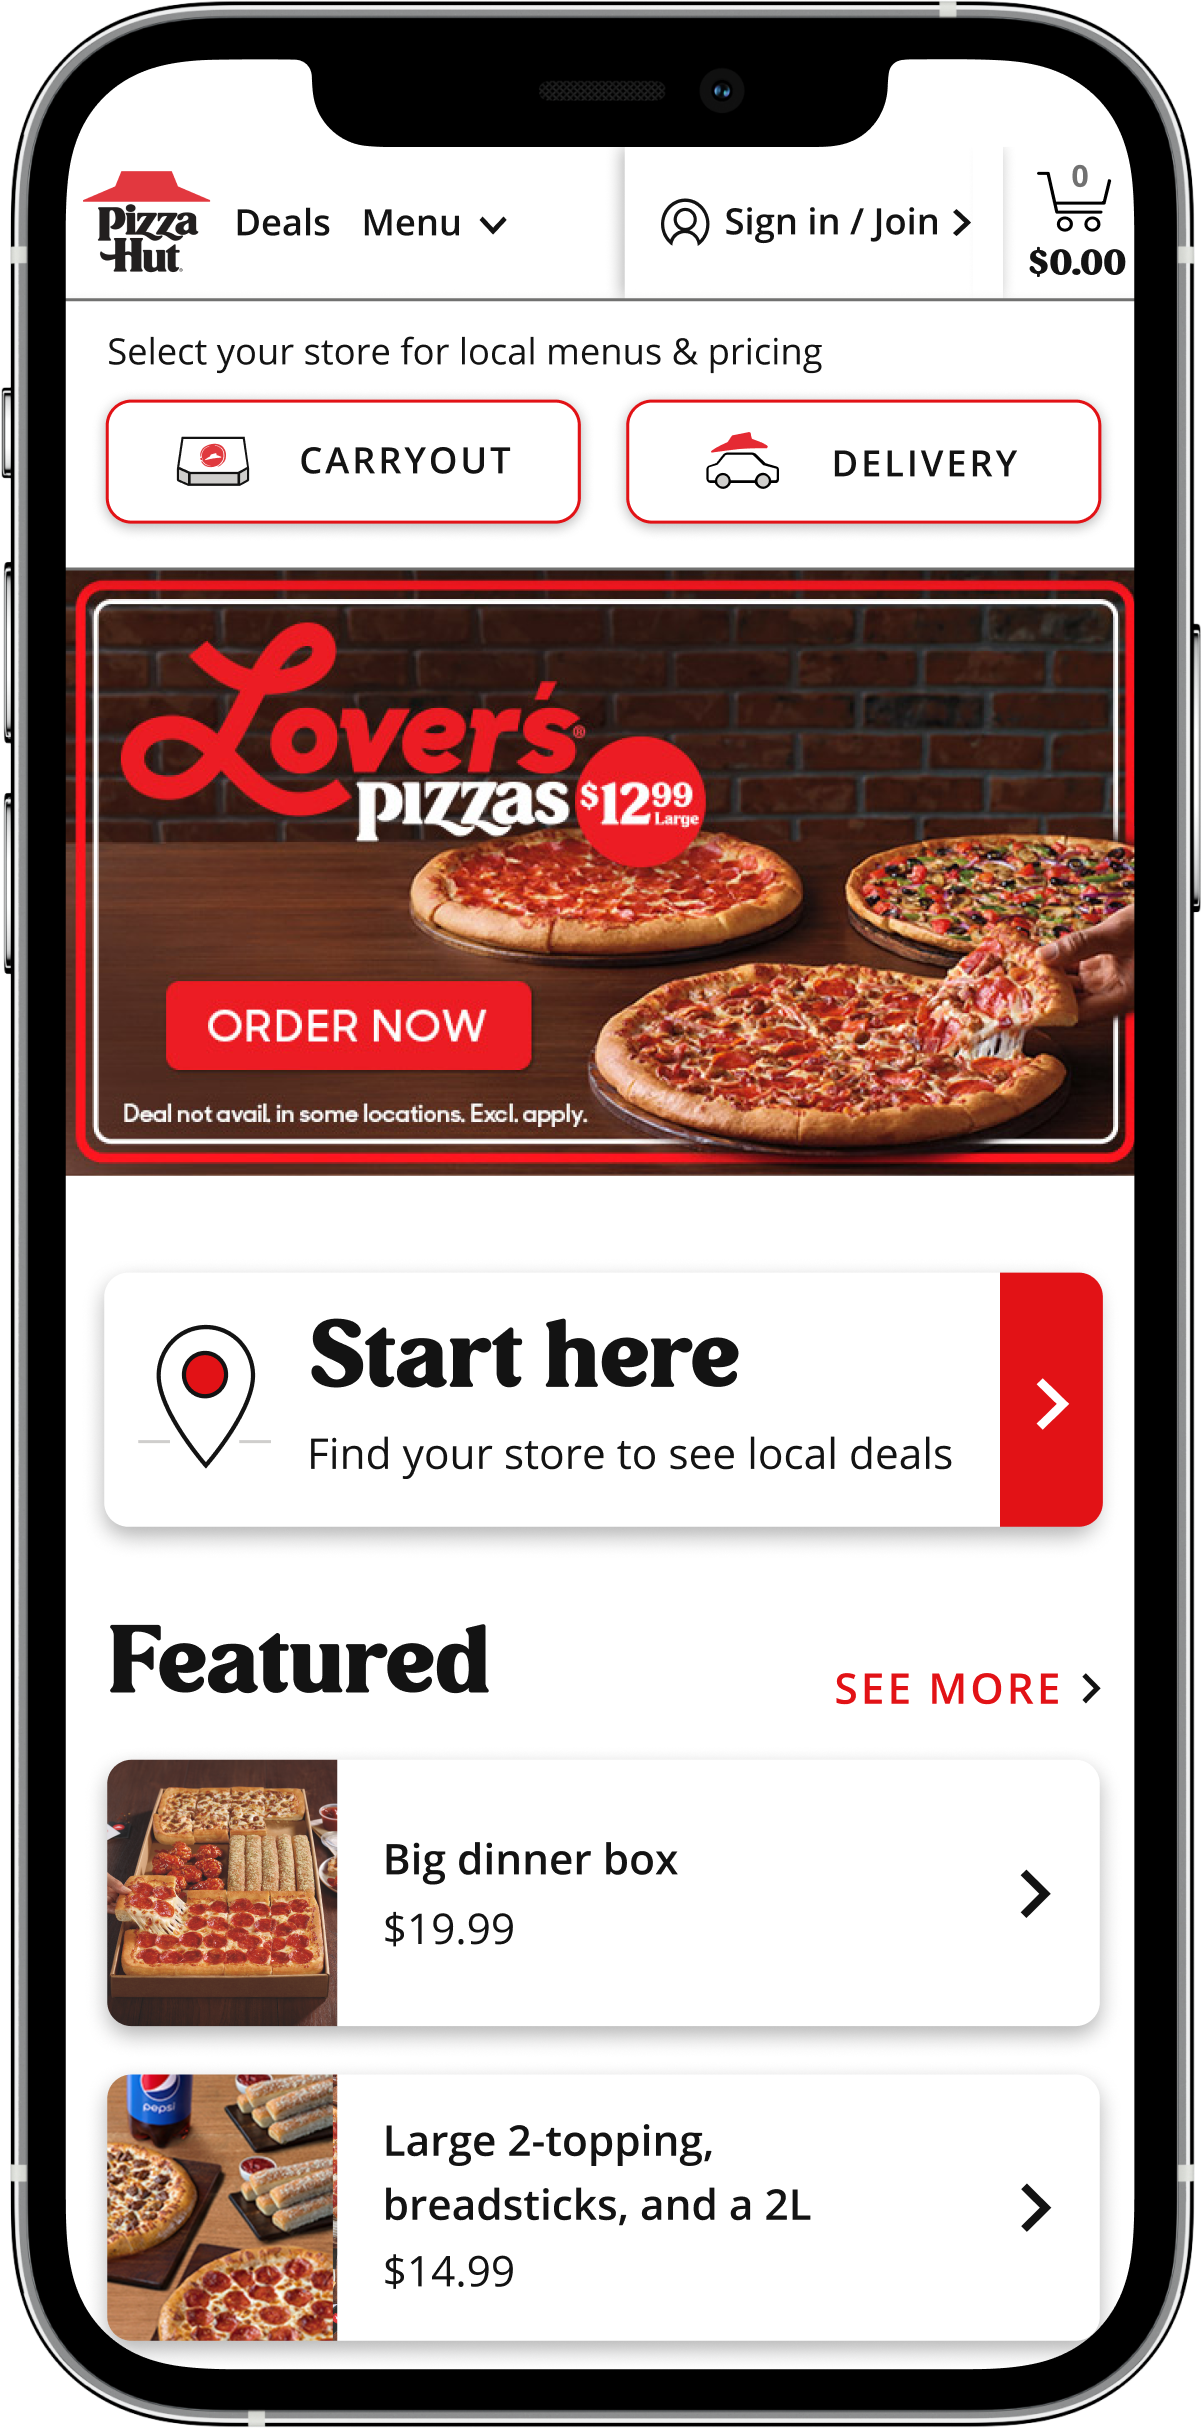
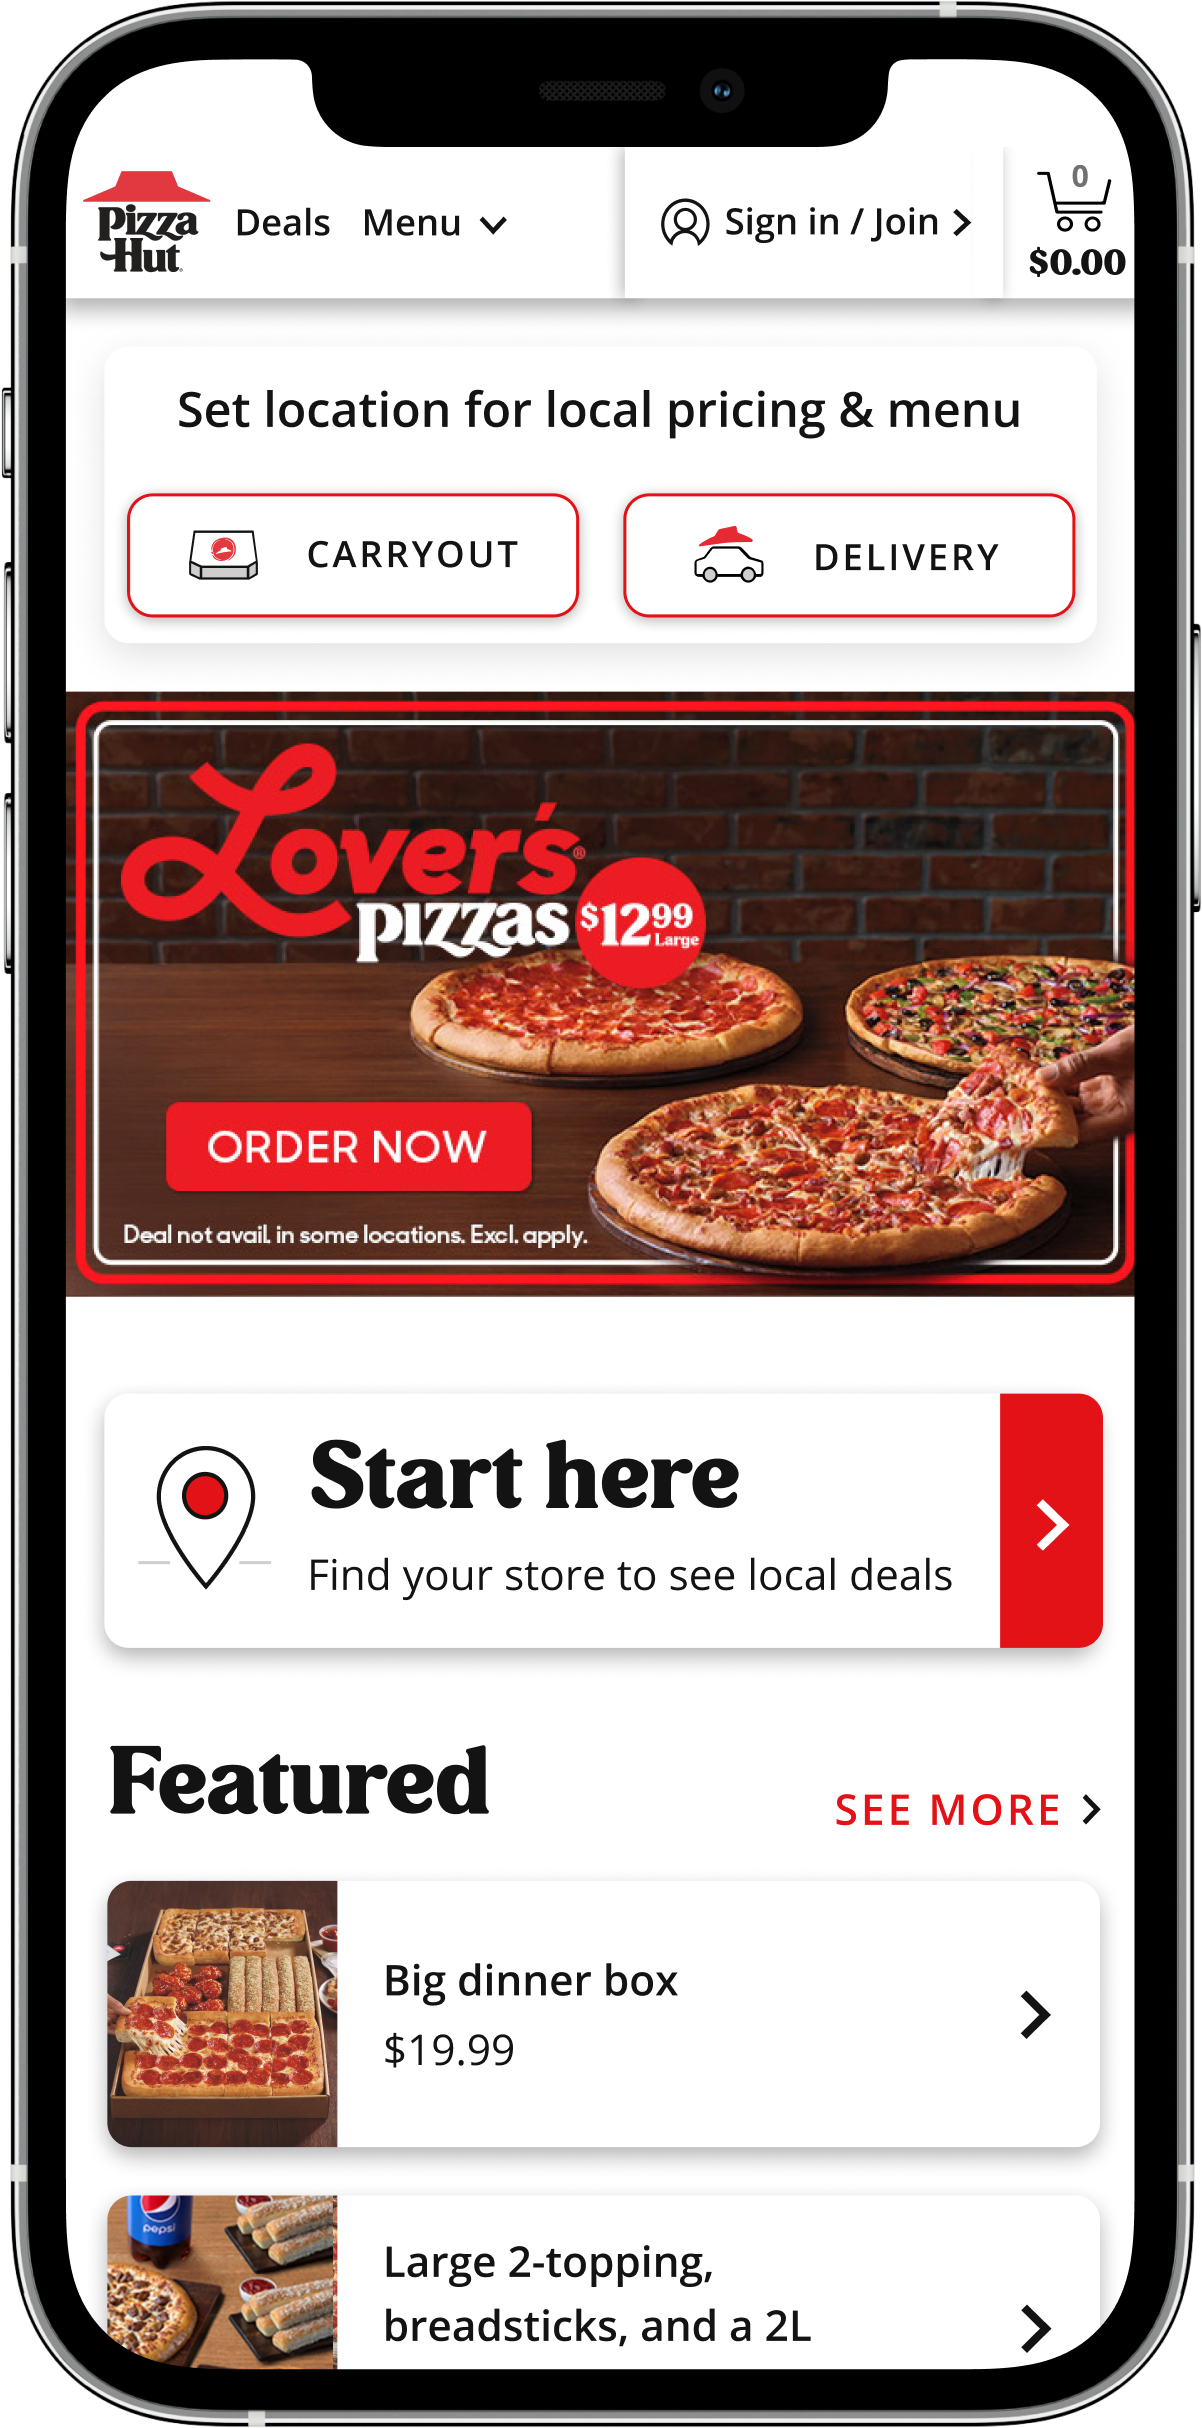
Hypothesis: Introducing a sticky localization banner will improve conversion by prompting users to select between delivery and carryout earlier in their shopping journey, allowing them to see local pricing and begin adding items to cart.
Key Metrics:

Localization Rate: 66.8%
Conversion Rate: 28.0%
Localization Rate: +1.34%
Conversion Rate: +1.13%
Localization Rate: +1.30%
Conversion Rate: +0.80%
Winning Variant Impact: Based on the localization and conversion rates of Variant 1, the estimated annual conversion lift is $11.2M. This design variant was delivered to the Merchandising Optimization team and deployed to prod in November 2024.